|
|
|
![]() The
Cathedrals of England and Wales: the league table
The
Cathedrals of England and Wales: the league table

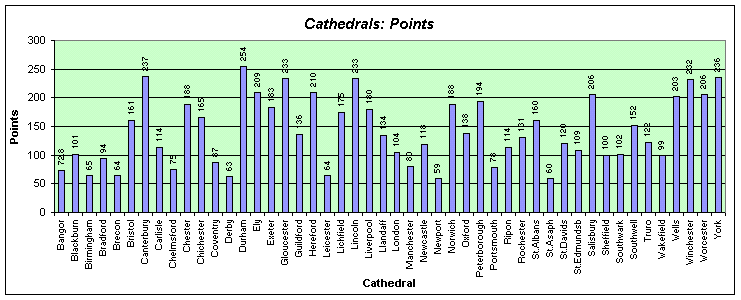
These figures are the total number of points, and the percentage of excellence calculated from them.
To see how the data is calculated, and the criterea on which the cathedrals are assessed, click here!
| Bangor | Blackburn | Birmingham | Bradford | Brecon | Bristol | Canterbury | Carlisle | Chelmsford | Chester | Chichester | Coventry |
| 72.8 | 101 | 65 | 94 | 64 | 161 | 237 | 114 | 75 | 188 | 165 | 87 |
| 26.96 | 37.41 | 24.07 | 34.81 | 23.70 | 59.63 | 87.78 | 42.22 | 27.78 | 69.63 | 61.11 | 32.22 |
| Coventry | Derby | Durham | Ely | Exeter | Gloucester | Guildford | Hereford | Leicester | Lichfield | Lincoln | Liverpool | Llandaff |
| 87 | 63 | 254 | 209 | 183 | 233 | 136 | 210 | 64 | 175 | 233 | 180 | 134 |
| 32.22 | 23.33 | 94.07 | 77.41 | 67.78 | 86.30 | 50.37 | 77.78 | 23.70 | 64.81 | 86.30 | 66.67 | 49.63 |
| London | Manchester | Newcastle | Newport | Norwich | Oxford | Peterborough | Portsmouth | Ripon | Rochester | St.Albans |
| 104 | 80 | 118 | 59 | 188 | 138 | 194 | 78 | 114 | 131 | 160 |
| 38.52 | 29.63 | 43.70 | 21.85 | 69.63 | 51.11 | 71.85 | 28.89 | 42.22 | 48.52 | 59.26 |
| St.Asaph | St.Davids | St.Edmundsbury | Salisbury | Sheffield | Southwark | Southwell | Truro | Wakefield | Wells | Winchester |
| 60 | 120 | 109 | 206 | 100 | 102 | 152 | 122 | 99 | 203 | 232 |
| 22.22 | 44.44 | 40.37 | 76.30 | 37.04 | 37.78 | 56.30 | 45.19 | 36.67 | 75.19 | 85.93 |
| Worcester | York |
| 206 | 236 |
| 76.30 | 87.41 |
![]()
*forthcoming*